Check WAF Utilization
Typically, CPU is the main resource constraint for a WAF, since a WAF’s primary function is to inspect/parse large amounts of HTTP/HTTPS traffic.
To check the CPU utilization of the WAF:
- In the Alert Logic console, click navigation menu (
 ) > Configure > WAF, and then click the Appliances tab.
 - In the item row of your appliance, click the appliance name.
- In the Managed WAF console, click Traffic.
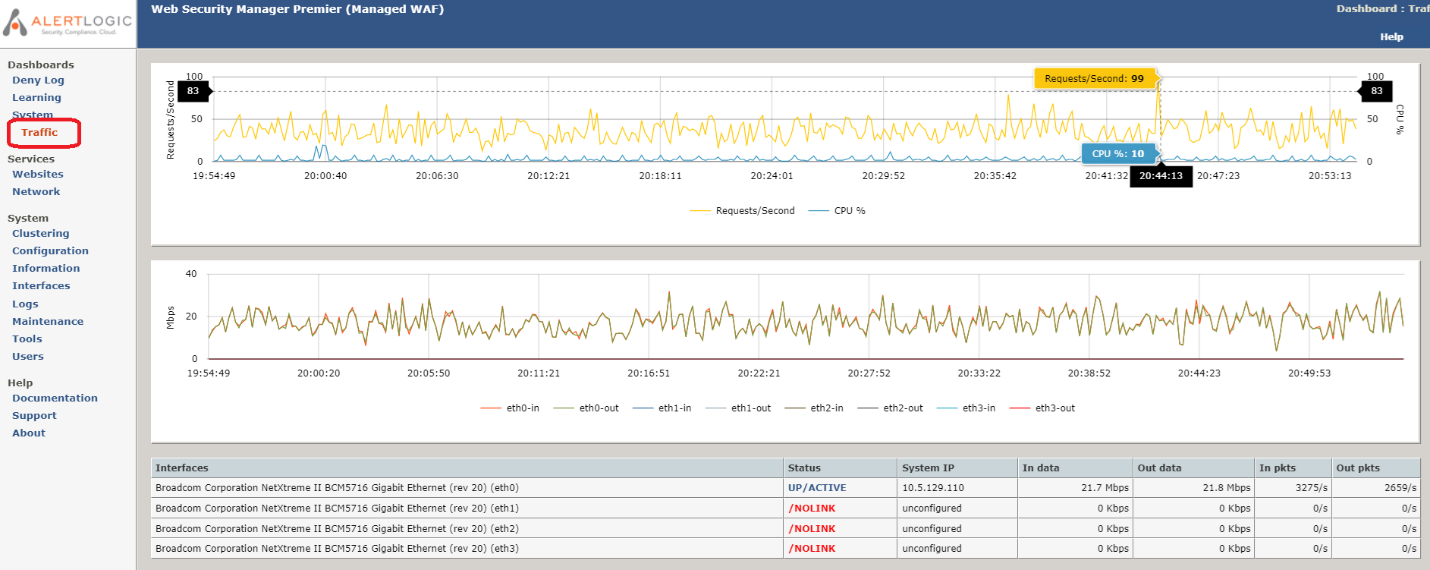
Note the CPU % (blue line) in the top graph. CPU utilization is usually the most important resource to monitor on the WAF. For best practice, Alert Logic recommends keeping CPU % under 50% for normal operations. Do not be concerned about brief spikes in CPU % (for one to two minutes), as that is normal for occasional background processing and housekeeping tasks. If you regularly see sustained CPU utilization exceeding 80% for 2 minutes or longer, we would recommend that you increase CPU resources for the WAF.
To increase CPU resources:
- Active-Active High Availability (HA) WAF: Typically, cloud-based WAFs with a load balancer in front (such as AWS, Azure, or GCP WAFs) or physical/virtual WAFs with a load balancer in front are configured for active-active operation. This means that all WAF instances/VMs in the cluster are processing HTTP/HTTPS traffic. To increase CPU resources for an active-active HA WAF, you can either change the instance/VM size to one with more CPU capacity or add more WAF instances/VMs to the cluster.
- Active-Backup High Availability (HA) Virtual WAF: A virtual (VMWare) WAFs without a load balancer in front, using VRRP clustering. In this configuration, one WAF VM is active, while the other WAF VM acts as backup and does not process HTTP/HTTPS traffic. To increase CPU resources for a virtual WAF, you can add more CPUs to the WAF VMs.
- Active-Backup High Availability (HA) Physical WAF: A physical (hardware) WAFs without a load balancer in front, using VRRP clustering. In this configuration, one WAF VM is active, while the other WAF VM acts as backup and does not process HTTP/HTTPS traffic. To increase CPU resources for a physical WAF, please contact the Alert Logic support to discuss upgrading the WAF hardware to a larger size.
- AWS Autoscaling WAF: The CPU % graph indicates the CPU utilization of the Master WAF, not the Autoscaling Worker WAFs. In an Autoscaling WAF, the Master WAF does not process HTTP/HTTPS traffic, but instead act as the control point for configuration changes and log aggregation. If you see CPU % exceeding 80% on an Autoscaling WAF, the Master WAF itself may need additional CPU resources. Please contact Alert Logic support for assistance with increasing the instance size of the Master WAF. To monitor CPU utilization of the Worker WAFs, you should use AWS CloudWatch metrics instead.